Page 8 - Annual Report 2019
P. 8

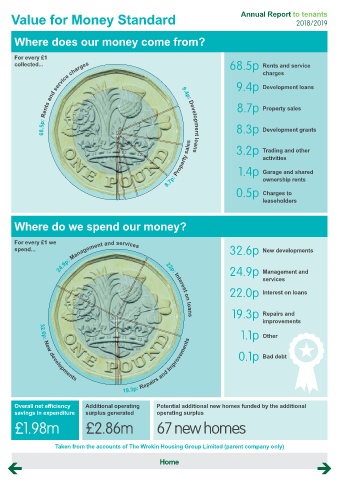
Value for Money Standard                                                         Annual Report to tenants
                                                                                                         2018/2019

      Where does our money come from?


      For every £1
                68.5p: Rents and service charges                 9.4p: Development loans   9.4p  Development loans
      collected...                                                                68.5p      Rents and service
                                                                                             charges


                                                                                    8.7p
                                                                                             Property sales


                                                                                    8.3p
                                                                                             Development grants
                                                            8.7p: Property sales    3.2p     Trading and other


                                                                                             activities
                                                                                     1.4p
                                                                                             Garage and shared


                                                                                    0.5p     ownership rents
                                                                                             Charges to
                                                                                             leaseholders


      Where do we spend our money?


      For every £1 we
                      24.9p: Management and services
      spend...                                                                    32.6p      New developments


                                                                                  24.9p
                                                                                             Management and
                                                                                             services

                                                                                  22.0p      Interest on loans


                                                                                  19.3p      Repairs and

                                                                                             improvements
                                                           22p: Interest on loans
                                                                                      1.1p   Other
                                            19.3p: Repairs and improvements          0.1p    Bad debt


               32.6p: New developments


      Overall net efficiency   Additional operating     Potential additional new homes funded by the additional
      savings in expenditure   surplus generated        operating surplus
      £1.98m                   £2.86m                   67 new homes


                    Taken from the accounts of The Wrekin Housing Group Limited (parent company only)

                                                         Home
   3   4   5   6   7   8   9